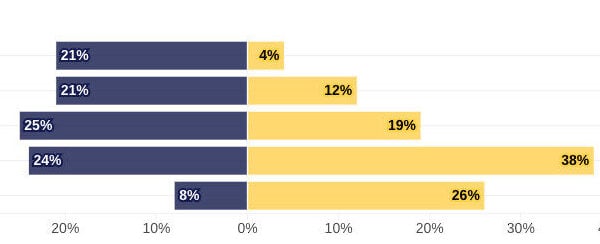
From this data, we created a series of charts to help visualise the key trends:

We took away four key messages:
1. The number of residential family assessment centres continues to increase
The number of residential family assessment centres continues to grow: in March 2016 there were 37 centres – there are now 117. This reinforces questions raised in our 2025 briefing, Residential family assessment centres: Data trends and questions, which highlighted evidence gaps relating to these centres.
Since then, there has been growing attention to residential family assessment centres. In addition to local work, Ofsted’s National Director for Social Care, Yvette Stanley, has highlighted in her blog the need to better understand these settings ‘as a matter of urgency’. Mary Baginsky and Rick Hood of King’s College London have published on Residential family assessment centres in England: assessment, support and decision-making in child protection and family justice, emphasising the need for further research and highlighting England as an outlier internationally in terms of the scale of provision and the close integration of residential family assessment centres with family court decision-making. Nuffield Family Justice Observatory has also commissioned further research in this area from Claire Mason at Lancaster University, which will be published by the end of 2026.
2. The number of children’s homes has increased substantially – but the average number of places per home continues to fall
The number of children’s homes has increased significantly – by around 20% over the last year (from 3,946 to 4,747). This is a significant rise and reflects continuing changes in the children’s social care landscape. Although the total number of places continues to grow, the average number of places per children’s home continues to fall.
The numbers alone do not tell us whether children are being placed in the settings that best meet their needs or whether outcomes are improving. Research on children’s homes placements from Kingston University and the National Children’s Bureau released this year showed that children’s homes can provide stability in crisis, but around 1 in 5 children’s home placements ended in an unplanned move within 12 months, and young people who had lived in children’s homes had worse early adult outcomes than other care leavers. The research also showed that workforce stability matters. Recent attention has focused on reviewing professional development for children’s home workforce and rightfully providing greater support for young people transitioning from care, including supporting enduring relationships.
3. Supported accommodation remains an area to watch
The data also points to the continued growth and development of supported accommodation for 16- and 17-year-olds in care and for care leavers. The most common type of supported accommodation (37%) is a self-contained unit, but supported accommodation can also include shared- or group-living for only children in care and care leavers, shared- or group-living not limited to those with care-experience, and supported lodgings in a home.
However, caution is needed when interpreting what the growth means because the current regulatory framework is still relatively new and only a minority of settings (around 17%) have so far been inspected. There are already signs of variable quality: more than half were found to have inconsistent quality or serious and widespread weaknesses. These findings matter because supported accommodation serves young people at a critical stage in their transition to adulthood. As highlighted in the Nuffield Foundation Generation abandoned? report by Nuffield Family Justice Observatory Director Lisa Harker, there are ongoing concerns about young people expected to move towards independence too early.
4. Variation in provision and quality persists and evidence gaps remain
The statistics also reveal regional variation, alongside variation in the quality of provision for both children in care and parents and children placed in residential family assessment centres.
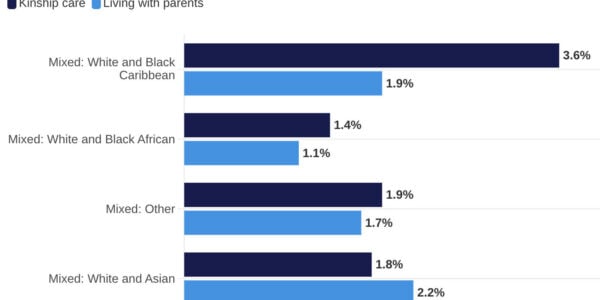
At the same time, evidence gaps remain. The available data tells us little about inequalities in experiences and outcomes, including differences by ethnicity, disability, gender and other protected characteristics. Improving data collection and analysis will be essential to developing a more complete understanding of how children’s social care services are operating and whether they are meeting the needs of all children and families equitably.
Explore the data
Are you interested in broader trends in family justice? Explore our chart of the month, data tracker and children in the family justice system infographic.