The aim of this briefing paper is to increase awareness of inequalities that exist across ethnic groups in the family justice system and how we can monitor and measure this using data.
Introduction
There is a growing recognition and acceptance that there are deep inequalities in children’s social care. Research suggests that children from Black and some Mixed or multiple ethnic groups are most likely to be in care, while children from Asian ethnic groups are the least likely. White children sit somewhere in the middle of the two (Bywaters and the Child Welfare Inequalities Project Team 2020; Owen and Statham 2009). An understanding of the factors that shape these inequalities is crucial for practitioners and policymakers working in this area if progress is to be made in addressing them. A one-size-fits-all policy will not fly.
Yet the evidence base that we can draw on is limited. The criminal justice system is well acquainted with ethnic disparities that continue to permeate through the system, but the family justice system is lagging behind as research remains relatively scarce. Despite this, there have been some important findings. The link between deprivation, social care intervention and ethnicity was studied in the Child Welfare Inequalities Project (Bywaters and the Child Welfare Inequalities Project Team 2020). The research found that there are ethnic disparities in intervention rates with White children having higher intervention rates than almost all other ethnic groups.
More recently, the issue has gathered some attention in policy circles. The Department for Education (DfE), commissioned by the Independent Review for Children’s Social Care, undertook a descriptive analysis of the representation, experiences and outcomes of children in social care by ethnic group (Ahmed et al. 2022). Using the Children in Need (CIN) census and the Children Looked After (CLA) census, they found children from White and Mixed or multiple ethnic groups had the highest rates of child protection plans and were the most likely to be looked after a year after referral.
In addition, the Independent Review of Children’s Social Care (MacAlister 2022) heard from a range of families and professionals to better understand why some children are more likely to enter care. The families and professionals spoke of different cultural norms around family, and the suspicion and mistrust of the system that exists within communities. What Works for Children’s Social Care conducted a survey of social workers and found that almost one in three had witnessed racism directed towards families/service users by colleagues or managers one or more times (Gurau and Bacchoo 2022).
This existing research has focused almost entirely on social care intervention, using aggregate-level data – but little research has investigated ethnic disparities in care proceedings themselves. The distinction is an important one. Firstly, not all children who are looked after will experience care proceedings. Secondly, usually, though not always, children will have had some interaction with social care services prior to going into care proceedings. We know next to nothing about how the court and judiciary play a part – and crucially whether they amplify existing disparities within the children’s social care sector or mirror them.
This briefing paper reports the findings from an analysis of the ethnic composition of children in care and supervision proceedings in England. The analysis uses population-level data from Cafcass England. Until recently this has not been possible as information on ethnicity was not routinely collected in Cafcass data prior to 2017.
The analysis examines: differences in the demographic characteristics of children from different ethnic groups in care proceedings; legal outcomes for those children; how long it takes to get to a final order; where children are living; and whether parents come back to court after the final order is made.
Key points
- In terms of legal orders, the analysis shows Black and Asian children are less likely to be on an adoption/placement order than children who are from White and Mixed or multiple ethnic groups. While this is not a novel finding, our analysis shows that it cannot be explained by ethnic differences in age, location, nor being part of a sibling group in proceedings.
- Black and Asian children, on average, receive legal orders that we class as ‘less interventionist’ than their White counterparts. Adoption is the most intrusive form of state intervention in family life, and therefore this is defined as the most interventionist on a sliding scale down from secure accommodation/ deprivation of liberty orders, care orders, special guardianship orders (SGOs), child arrangements orders (CAOs), supervision orders, other orders, to orders of no order. Adoption and SGOs are most prevalent among children who are White and from Mixed or multiple ethnic groups. Legal orders made for Black and Asian children are more likely to be the lower end of the scale of ‘interventionism’. They are both more likely to have a supervision order and more likely to have an order of no order than children who are White or from Mixed or multiple ethnic groups.
- However, there is an important exception to this. A higher proportion of Black and Asian children have a secure accommodation or deprivation of liberty order than White and Mixed or multiple ethnicity children.
- Black and Asian children are, on average, older upon entering care proceedings for the first time. They live in more deprived local authorities, although the deprivation levels in the local neighbourhoods they live in are similar to White children and children from Mixed or multiple ethnic groups. And their cases take longer to conclude.
A lack of access to good quality data has been, and continues to be, a barrier to researchers. Using aggregate data from a small sample of local authorities is challenging in this context and there may be unease about the representativeness of the selected local authorities. This is particularly important given many areas of the UK have varying levels of ethnic diversity and social work cultures and practice varies greatly from area to area. Improvements in the collection of ethnicity data by Cafcass England facilitate this analysis but there is a need to think about other sources of data and data linkages that are necessary in order to explore some of these issues further.
Data
This analysis uses population-level administrative data from Cafcass England.
The sample consists of 105,334 children in England who had their first episode of care proceedings between 2016/17 and 2021/22 and for whom the case was concluded by the end of the observation period.6 Analysis is conducted at the child level and includes all children who had non-missing values for age, gender, ethnicity and region.
Unless specified, ethnicity refers to the ethnicity of the child. It is coded into five high-level ethnic group categories that were used in the 2021 census in England – Asian or Asian British; Black African, Caribbean or Black British; Mixed or multiple ethnic groups; White; and Other ethnic group. Ideally, it would have been possible to further breakdown these broad ethnic groups, but sample sizes did not always permit this.
Ethnicity data is usually captured by the children’s guardian. In initial interviews, the guardian would ask the child or parent how they identify themselves. Sometimes it is not possible to obtain this information, for example if the parent is absent, then the guardian may refer to existing documents such as the social worker statement or the application. There is also a section in the child’s plan within the case management system where the guardian should write about the child’s ethnicity.
For all public law cases, Cafcass knows which local authority has brought the proceedings. This can be used to derive the region the child lives in. In order to get a more precise location, which is important for looking at area-level deprivation, the child’s address history is used.
Identifying the legal order made presents a challenge because a child may have more than one legal order within a case, for example a supervision order can often be combined with an SGO or CAO.9 The strategy we take involved determining, in the scenario in which a child has more than one legal order, which legal order is the most interventionist. This order can thus be interpreted as the ’highest’ legal order made. The hierarchy is defined as follows in order of more interventionist to least interventionist: adoption/placement order, secure accommodation/deprivation of liberty, care order, special guardianship order, child arrangements order, supervision order, any other order, no order/order of no order, and a category which comprises unknown/missing values.
Where we refer to differences between ethnic groups these differences have been tested for statistical significance. The significance testing results are not reported here but are available on request.
Key findings
Ethnicity in the family justice system over time
The ethnic profile of children in care proceedings has remained fairly constant over the last five years in England. Using data combined across the 5 years, White children account for 78% of children in care proceedings. Children from Mixed or multiple ethnic groups were the second most frequently reported group at around 11% of children. Black children made up 5% and Asian children 4% of care proceedings.
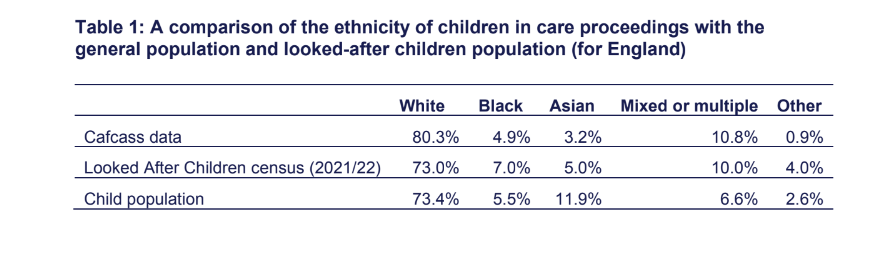
Table 1 shows a comparison of the ethnic composition of children in care proceedings, with the child population and the looked-after population of children for 2021. It shows that White children are over-represented in care proceedings – they made up 73.4% of the population, yet account for 80.3% of care cases in 2021. Children from Mixed or multiple ethnic groups are also over-represented compared to the population. Black children are slightly under-represented, and the proportion of Asian children in care proceedings is well below the proportion of Asian children in the general population in England.
This contrasts with the population of all looked-after children, which shows that Black and Mixed or multiple ethnicities are over-represented. The proportion of looked-after White children is in line with the child population in England, and children from Asian ethnic groups are under-represented as is the case in care proceedings. This difference likely stems from the different populations that the two data sources capture. Some children in the Looked After Children census may never have been through court due to section 20 voluntary arrangements and respite care arrangements, though it is not possible to quantify this. It is important to determine whether there are differences by ethnicity of the child in the use of section 20 voluntary arrangements.
Demographic characteristics of children in care proceedings
The analysis showed that there were no differences in the gender split in public law proceedings for all ethnic groups, with an overall 50/50 proportion of girls and boys.
A higher proportion of children in Asian ethnic groups had a sibling subject to the same proceedings. Asian families also differed in that they were considerably more likely than other groups to have both parents named as respondents. This finding may be linked to family composition. A report from the Children’s Commissioner (2022) found that Asian parents are more likely to be married, and that a greater proportion of Black families and families from Mixed or multiple ethnic groups are single-headed households.
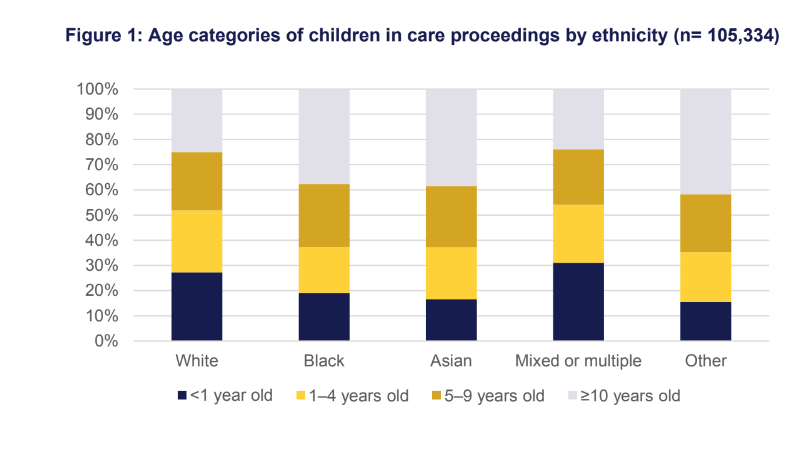
Children who are of White or Mixed or multiple ethnicity are younger than children in other ethnic groups at the start of proceedings. Black, Asian, and children from Other ethnic groups were on average 7 years old at the start of proceedings, while children from White and Mixed or multiple ethnic groups were 5 years old on average. Figure 1 shows that 27% of children from White and Mixed or multiple ethnic groups come into court proceedings before they are a year old, compared to 19% of Black children and 16% of Asian children. The proportion of children aged 10 or over is highest for children who are Black, Asian or from Other ethnic groups.
From this it is not possible to assert whether the state is intervening too early or too late until we have reliable evidence about whether there are ethnic differences in outcomes, however, it is striking that there are such large disparities in the age we first observe these children in court.
The role of location and deprivation
The data shows that UK regions vary widely in terms of ethnic composition of children in care proceedings. As shown in Figure 2, London is very ethnically diverse compared to other regions, with 60% of children in public law proceedings coming from minoritised ethnic groups.The North East is the least ethnically diverse, with 92% of care proceedings involving White children.

The analysis uses the English Index of Multiple Deprivation (IMD) to look at relative deprivation where children in care proceedings are living. There are two measures of IMD that are used in this analysis. The first is local authority IMD, which ranks the 317 local authorities into five quintiles. This means the least deprived is the lowest ranking 20% of local authorities. The second measure is the lower-layer super output area (LSOA) IMD, which covers much smaller areas (on average an area will comprise just 1,500 residents) that we might describe as small neighbourhoods. This measures deprivation on a much more local level.
Looking at the first measure (local authority IMD), the findings in Figure 3 indicate that Asian and Black children are more likely to live in the most deprived local authorities compared with White children and children from Mixed or multiple ethnic backgrounds. Over 40% of Asian children live in the most deprived local authorities, compared with just 21% of White children.
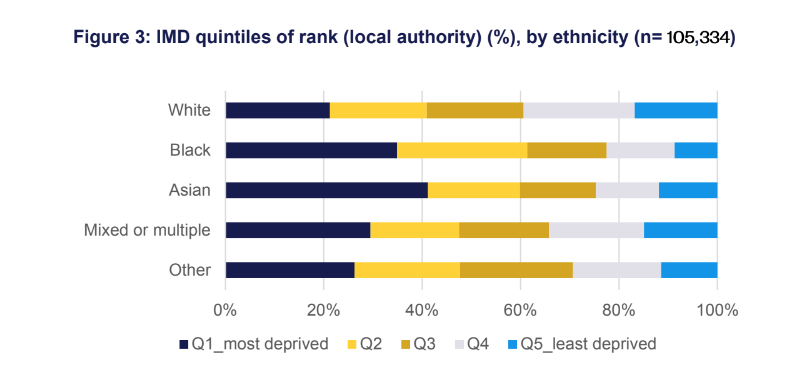
However, when looking at deprivation levels at the more granular LSOA level (see Figure 4), the gap closes. In fact, now White children are the most likely to live in the most deprived small neighbourhoods at 46% – not dissimilar to the percentage of Asian, Black and Mixed or multiple ethnic groups. This implies that children are living in quite similarly deprived, small neighbourhoods – but White children are more likely to live in deprived neighbourhoods within a more affluent local authority.

This has important practical implications. Given that children of all ethnicities are living in similarly deprived, small neighbourhoods but Black children live in less affluent authorities, this raises the question of whether there are differences in the provision of services that these families have access to. Do more affluent local authorities have more resources/services to support these children? And if within a local authority there are many deprived neighbourhoods then there may be greater demand leading to increased pressure on resources. This may make a difference to the services that children and parents receive.
It is worth noting that we find that over 70% of all children in care and supervision proceedings live in the two most deprived quintiles. Previous research (Bywaters and the Child Welfare Inequalities Project Team 2020, p.4) has also highlighted that children in the most deprived IMD decile were over 10 times more likely to be looked after than a child in the least deprived decile. The intersection of deprivation and ethnicity is important to consider in examining social care intervention rates. Webb et al. (2020) show there is a higher ‘social gradient’ for White children. This means that social care intervention rates are higher when local deprivation levels are higher. Conversely, there is a weaker association between intervention rates and deprivation for Black children.
Legal order and time taken to get to a final order
The legal order varies considerably across ethnic groups and the most marked difference is in placement/adoption rates. White and Mixed or multiple ethnic groups have a higher proportion of children who are adopted compared to Black, Asian and Other ethnic groups. This corresponds to 16.5% of White children, and 15.6% of children from Mixed or multiple ethnic groups being on a placement/adoption order, compared to 5.8% of Black children and 4.7% of Asian children.
It is important to understand that the legal order may be related to a host of other factors (which may differ by ethnicity). One of these is the child’s age which, particularly in the context of adoption, will feature prominently in court decision making. Given that children of White and Mixed or multiple ethnicity are on average two years younger and more likely to enter care proceedings as babies than Black and Asian children, age could be the reason for more frequent use of adoption/placement orders for children who are White or from a Mixed or multiple ethnic group. However, further analysis shows this is not the case. When restricting the sample to children under the age of 1, the differences in adoption/placement orders persist. Again, an analysis of children under the age of 6 shows a similar story.
Although important, age is not the only factor to consider. Another potential explanation could relate to the finding that Black and Asian children are more likely to be in a sibling group. This is another important consideration in decisions on whether to place a child for adoption. This hypothesis is not substantiated in the data. The disparity remains when looking at ethnic differences in adoption rates among children who are not in a sibling group.
In terms of factors external to the family situation, the pool of prospective adoptive parents in the region may be important. Data from Coram-i reports adoption statistics with ethnic breakdowns. Relating these numbers to the proportions of children in care proceedings shows that White children are over-represented in care proceedings as well as the adults who are prospective adopters. In 2020/21, 90% of approved adopters were White, whereas White adults make up 83% of the population. Approved adopters from Black ethnic groups made up 2% of all approved adopters but account for 4% of the population. Asian adults were similarly under-represented as approved adopters.
As discussed in the previous section, some regions have higher levels of ethnic diversity – London being the most diverse. There are variations in the use of orders across designated family judge areas. If London is less likely to use certain legal orders, then this may be capturing a regional effect rather than one related to ethnicity. To try and understand the extent to which this may influence our results, the analysis sample is split into the London region and rest of the country. The ethnic disparities remain, though the analysis shows that adoption is, in general, used less in London than the rest of the country.

Figure 5 also shows differences in the use of SGOs – 18% of White children are placed on an SGO, followed by 17% of children from Mixed or multiple ethnic groups. This falls to 13% for Black children and 7% for Asian children. This raises several questions, which may relate to wider family support networks, in terms of both cultural differences and how the court/social workers interact and do due diligence on these family networks.
Interestingly, there are no ethnic differences in the use of CAOs, but there is varying use of supervision orders (as the highest legal order). Children who are White or from Mixed or multiple ethnic groups have the lowest rates of supervision orders at 12% and 15% respectively, compared to 21% for both Black and Asian children.
A judge will make decisions on the legal order granted based on the fundamental no order principle, found in Section 1(5) of the Children Act 1989, which states a judge must not make an order concerning a child if they consider that to do so would be better for the child than to make an order. Figure 5 shows that the proportion of no orders made for Black and Asian ethnic groups (9% and 15% respectively) is higher than for children of White and Mixed or multiple ethnic groups (4% and 5% respectively). This implies that the court deems little need for intervention in these families, particularly when it comes to Asian children. It raises a question as to whether these families needed to be in court at all? Indeed, with all orders taken together, Black and Asian children are often granted the least interventionist orders proportionally, and White and Mixed or multiple ethnicities subject to a higher degree of state intervention in their family life at final order outcome.
However there is one important exception. Deprivation of liberty (DoL) and secure accommodation orders have been grouped together based on the severity of the intervention and small sample sizes for each of the two groups. It is clear that proportions of these orders are higher among Black and Asian children – 1.3% compared to 0.5% – though it should be caveated that sample sizes are small. This adds to a recent NFJO analysis of DoL applications (Roe and Ryan, 2023) who, despite limitations with the collection of ethnicity data, found suggestive evidence of an overrepresentation of children from Black, Mixed and White Other ethnic backgrounds among children subject to DoL applications.
Interpreting the remaining legal orders in the chart above requires more caution because of nuances in the data. The Cafcass data includes a category called ‘care order’. Unfortunately a care order can be for several placements – foster care, family and friends placement, and placement at home with parents – but it is not possible to distinguish between these.
There were also differences between different ethnic groups in terms of the average time taken to complete proceedings. Over 60% of all cases took longer than the Public Law Outline 26-week target to reach a legal order outcome. However, in cases involving either Black, Asian or children from Other ethnic groups, over 20% took longer than 52 weeks to conclude. The corresponding figure for White children was 16.7%.
Are parents coming back to court?
Concern has been raised about the risk of parents appearing in care proceedings more than once, either with a new child or the same child.
Here the analysis remains at the child-level and a recurrent parent is defined as the child’s mother or father who subsequently re-enters care proceedings with a new
child.
Figure 6 shows a higher proportion of children from White and Mixed or multiple ethnic groups had at least one recurrent parent than children in all other ethnic categories. In the case of children from White and Mixed or multiple ethnic groups, 17% had at least one recurrent parent compared to 10% of Black children and 6% of Asian children. The data does not enable us to say whether this is simply because these groups have fewer children, and so have less chance to recur, or whether outcomes for parents of children in these ethnic groups are better.

Reflections
This research has presented a high-level overview of differences in the demographic characteristics of children from different ethnic groups in care proceeding, the legal outcomes for those children, how long it takes to get to a final order, where these children are living, and whether parents come back to court after the final order is made.
It provides the basis for future work as it points to many questions that remain unanswered and under-investigated. The questions that we believe the research raises and require further investigation are as follows.
- Why are children from Black and Mixed or multiple ethnic groups entering court proceedings at older ages than children of other ethnicities?
- Why are children from Black and Asian ethnic groups less likely to be placed for adoption than children who are White or from Mixed or multiple ethnic groups? We have shown that the disparities remain when looking at various sub-samples for different ages, sibling groups, and in London versus all regions excluding London. And we are still no closer to understanding why this is the case.
- The finding that final legal order outcomes tend to be less interventionist for Black and Asian children is novel and important – but more research needs to be done to understand why this is the case. A qualitative approach or case file analysis could help shed further light on the issue.
- Why are cases taking longer for children from Black and Mixed or multiple ethnic groups? What factors are driving differences in the experience of families in the family justice system?
- The work suggests that there is a link between deprivation and ethnicity –but what is not known is the link between deprivation, ethnicity and the legal order made.
- We know there are differences in adoption rates, special guardianship,
supervision orders and the use of no orders, but we are missing robust evidence on care orders and placements – that is, whether children are placed in the care of family and friends or returned to their parents’ care. Is there any data that can tell us more about this? - To what extent does the legal order made by a judge differ from the order that was applied for by the local authority and are there any differences by ethnicity? This is important to know in trying to understand the reasons behind Black and Asian children receiving less interventionist legal orders.
- There are similarities in the demographic characteristics and legal outcomes of children from White and Mixed or multiple ethnic groups. Perhaps the ethnicity of the mother or father is driving these differences more than the child’s own ethnicity as the parent interacts with the system. To investigate this, the analysis could be repeated using the ethnicity of the mother.
- More in-depth analysis is needed, going beyond the five high-level ethnic group categories used in this analysis. Bywaters and the Child Welfare Inequalities Project Team (2020) show that there are differences in social care intervention rates within these groups. One example is that social care intervention rates differ between Black African and Black Caribbean ethnic groups.
- Progress has been made to better capture ethnicity in population-level data but it remains a challenge to draw robust conclusions. This includes the interpretation of differences in legal orders by ethnicity, which is particularly challenging due to the coding in Cafcass data that makes it impossible to distinguish between where, and with whom, children will be living when they are placed on a care order. Of course, this is a limitation of using administrative data, which is primarily designed for the purpose of operations rather than for research. Although the data offers the best possibility of understanding ethnic inequalities, changes to data collection would be welcomed to gain an understanding of the placement of the child and how this differs by ethnicity.
This descriptive analysis can help shine a light on different experiences of the family justice system by ethnicity. Multivariate regression analysis can go even further in identifying factors that drive outcomes and help to shape a future research agenda in understanding why there are such differences in final legal orders. This may help to understand the role of the court as well as external factors such as deprivation, social work practice and the impact they have on outcomes.
